

Winning the Game of Broken Telephone: A Blueprint for Evaluating AI Across the Research Pipeline
by Lindsey DeWitt Prat

Subscribe to get sharp thinking all about ResearchOps delivered straight to your email inbox. It’s free.

The ResearchOps Review is supported by User Interviews, now part of UserTesting. User Interviews makes it fast, easy, and affordable to recruit participants so you can scale research without sacrificing quality.
When I first lived in Tokyo, getting lost was a daily routine. It was the mid-2000s, pre-iPhone, and pre-Google Maps, so to find my way, I carried a paper subway map folded into quarters and a pocket notebook in which I’d written train times and transfer stations by hand. Back then, Tokyo’s rail network was operated by two companies and ran twelve subway lines across nearly 300 stations, plus an overground rail and private commuter lines feeding in from the suburbs (see Figure 1).1 Each network had its own fare system, signage conventions, and maps—they were beautiful and overwhelming. I could read Japanese pretty well by then, so navigational problems weren’t a result of language; it was orientation. I could find my station on the map, but I couldn’t locate myself in the system—the map on its own didn’t tell me that part.

If you’re in charge of delivering research operations, this feeling—that you know your surroundings, but it’s still hard to navigate—may be familiar, particularly if you’re also navigating the novelty of AI. One researcher working alone can afford to get lost in the tooling, networks, and workflows of doing research; a wrong turn simply becomes another learning. But when a research pipeline is being designed to repeatedly carry dozens or hundreds of people towards similar goals, not unlike a rail system, the operations equivalent of pouring over every map the night before (or in research parlance, every vendor comparison, prompt library, quality assurance checklist, or workaround doc), isn’t an option.
The Orientation Gap in AI Research
It’s a truism to say it’s important to know where you are and how to get where you want to go. That’s why we have maps for so many things these days, not only to help navigate cities and subway systems but also disease outbreaks, supply chains, and the internet itself. Research operations has maps, too. Kate Towsey’s foundational piece, “A framework for #WhatisResearchOps,” and her book, Research That Scales, lay out the primary elements of the discipline.2 For the research tooling landscape, the newly published User Interviews 2026 UX Research Tools Map catalogues nearly 800 tools. The map makes clear that AI tools in 2026 are their own kind of spiderweb-like network: more than 100 targeting qualitative analysis tools, seventy-nine “AI Research Companions,”3 forty-seven transcription services, and eighteen claiming to outright replace researchers or participants, or both. These maps are useful, but, like my paper subway maps, none of them situates you within the system. Many research professionals are navigating a complex system without knowing whether those tools are getting them where they need to go, and how to measure and monitor failures.
Why We Miss Failures
In his book Thinking, Fast and Slow, psychologist Daniel Kahneman outlined his famous two-system model of cognition: System 1 (fast, intuitive thinking) and System 2 (slow, deliberative thinking and risk weighing). A new preprint from the Wharton School of the University of Pennsylvania, “Thinking—Fast, Slow, and Artificial: How AI is Reshaping Human Reasoning and the Rise of Cognitive Surrender,”4 by Steven Shaw and Gideon Nave, adds a third model: artificial cognition operating outside the brain. The pressure to produce, the pace, and the volume all push toward Kahneman’s System 1: fast, intuitive thinking. Everyone is moving fast, and being pushed to move faster still. System 2, the slower, careful process that says “wait, let me check this,” is being squeezed. System 3 makes the squeeze worse, not better, imparting false confidence even as the underlying accuracy of the incoming information falls.
Shaw and Nave’s research showed 80 percent compliance with AI outputs even when the AI is systematically wrong, which suggests we “cognitively surrender” to fluent, formatted, confident output. It’s literally never been harder, on a brain level, to notice and catch when things break.
Earlier this year, I published an essay called “The Research Risk Cascade: Why Even ‘90% Accurate’ AI Tools Break Pipelines,” an attempt to bring some of Kahneman’s System 2 into the mix, map out what breaks and where in the typical research workflow, particularly when we rely only on System 3, and give you a map for making better decisions about which AI tools to use, how to use them, and where to insert human checkpoints.
In this article, I’ll share why and how AI research pipelines fail through compounding, obscure errors; why we miss those errors without thoughtful interventions; and how my five-step evaluation blueprint can help you locate where in the pipeline research accuracy is breaking.
How Meaning Degrades Across a Pipeline
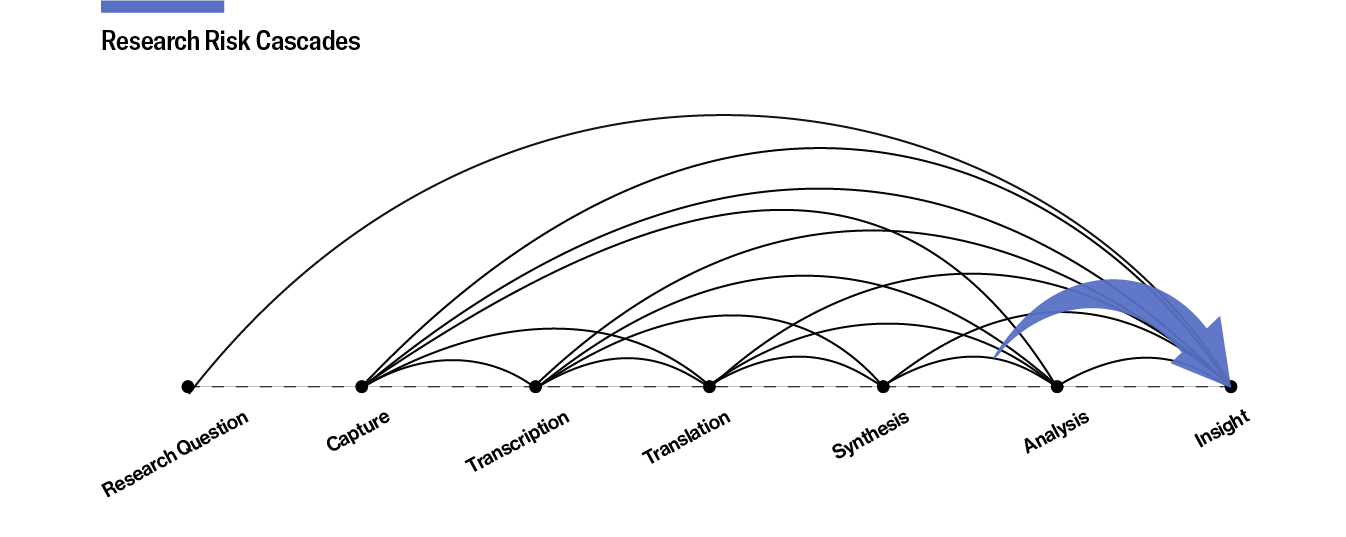
Remember that game called “broken telephone”? You and your friends sit in a circle; the first person thinks of a phrase, such as “In Japanese, ‘maybe’ usually means ‘no’,” and whispers it into the ear of the person sitting next to them, and around the circle the whisper goes. Invariably, by person five, the phrase has morphed into something completely different, like “Japanese babies know.” The same morphing of meaning happens in research pipelines. Each stage of the research pipeline, from research question to insight (see Figure 2), inherits everything that came before it, and reshapes it: transcription narrows what’s available to synthesize; synthesis can flatten variance, suppress outliers, smooth contradictions; and analysis can take place on outputs that appear fluent and tidy, even when the structure underneath has thinned.
Whether you’re using AI or not, every stage is like a “telephone game” whisper. But AI does introduce additional distance and confidence: distance, because you’re further from the source than if you were transcribing and coding by hand, and confidence, because AI outputs often read as fluent and certain, even if it’s not the case. As a result, the losses in data integrity are harder to notice. That’s System 3 overriding System 2. What looks like one tool on a research platform is often five or six different AI systems chained together—transcription, generative, and agentic aren’t all the same technology—and each has its own way of failing.5
Errors at each stage of the qualitative pipeline don’t add up so much as they multiply, or cascade, and language is at the heart of the error cascade because it’s the material that the whole pipeline is made of. Every step in the pipeline is a translation of some kind, from speech to text to theme to decision, and every translation loses something. For instance, an accent might be miscaptured at transcription; a hedge—an uncertainty or ambiguity—may disappear during synthesis; or a stance may be flipped during analysis. If you multiply those error rates together per stage, you’ll have a cascade of compounding errors. I call this a research risk cascade.
The Research Risk Cascade
As part of research for the essay I mentioned earlier, I modeled the risk cascade for various language configurations. The results are sobering. In a pipeline with Standard American English, the language most AI tools are optimized for, about 70 percent of the original signal likely survives from data capture to insight. That’s the best case, and it means that roughly a third of what was actually said, meant, or conveyed by the participant is gone before anyone reads the output. Add a well-resourced translation pair, such as French to English, and the fidelity of the insights drops to 46 percent. Working from Hindi, a language with over 600 million speakers worldwide, into English one could expect a fidelity loss of 35 percent. These aren’t cherry-picked numbers meant to shock you. In my view, they’re actually quite generous figures, built from public benchmark scores under clean, controlled test conditions—the same benchmarks model builders themselves use to publicly report accuracy.6
The messy, overlapping, ambient-noise audio recordings of actual research interviews is far harder than any benchmark. The prime question is: If your pipeline is losing 30 percent of its signal under ideal conditions, what’s happening under real ones?
Because many research tools are moving towards an agentic state: they’re not just “AI-powered” in the way that a transcription service is, instead, they chain multiple AI agents together to orchestrate entire workflows with minimal human intervention: upload your recordings; get your insights; your agents handle the rest. Because parts or all of the research pipeline are handled by the system itself, often in ways the interface keeps hidden, the error cascade is harder to see, and therefore the losses harder to catch.
The people building and deploying agentic AI systems—engineers, product teams, and the growing wave of vibe coders without traditional engineering backgrounds—are arriving at the same structural insight, and they’re saying so openly. Baptiste Jamin, CEO of Crisp, stood on stage at Paris AI Day 2026 and presented a slide titled “The Real Problem: Compounded Error.” While a single AI step might have 85 to 90 percent accuracy, if you chain it five times, that percentage will drop to roughly 44 percent overall reliability. “Agents don’t fail loudly,” Jamin told the packed room, “They fail statistically.”
The Evals² Experiment: What Happens When You Compare Outputs
To bring the error cascade to life, I took three five-minute clips from episodes of Lenny’s Podcast about AI evaluation practices, or “evals” for short, which featured three English accents (Standard American, Vietnamese-accented, and Indian-accented). I ran each through several transcription tools and several summarization and analysis models, and compared the results.7
Note that this experiment isn’t a recommendation to use off-the-shelf large language models (LLMs) for qualitative analysis, and it doesn’t claim the methodological rigor of a controlled study. It’s a diagnostic exercise: an eval. A way to pull the pipeline apart, examine each stage on its own, and see where a signal degrades, which is particularly important if you’re building research systems that will enable dozens or hundreds of research studies. Anyone can do it, with any source, such as a research interview or podcast episode, and you don’t need a technical background, custom tooling, or an engineering team. A side-by-side test on one source, done carefully, will tell you more about your research pipeline in an afternoon than any vendor accuracy claim.
I’m calling the places where outputs differ “divergences:” where two or more tools or LLM models produced different readings of what was said, what it meant, or what mattered. Some are outright errors, while others are subtle shifts in tone or emphasis. More importantly, all of them are easy to miss if you only look at one output.
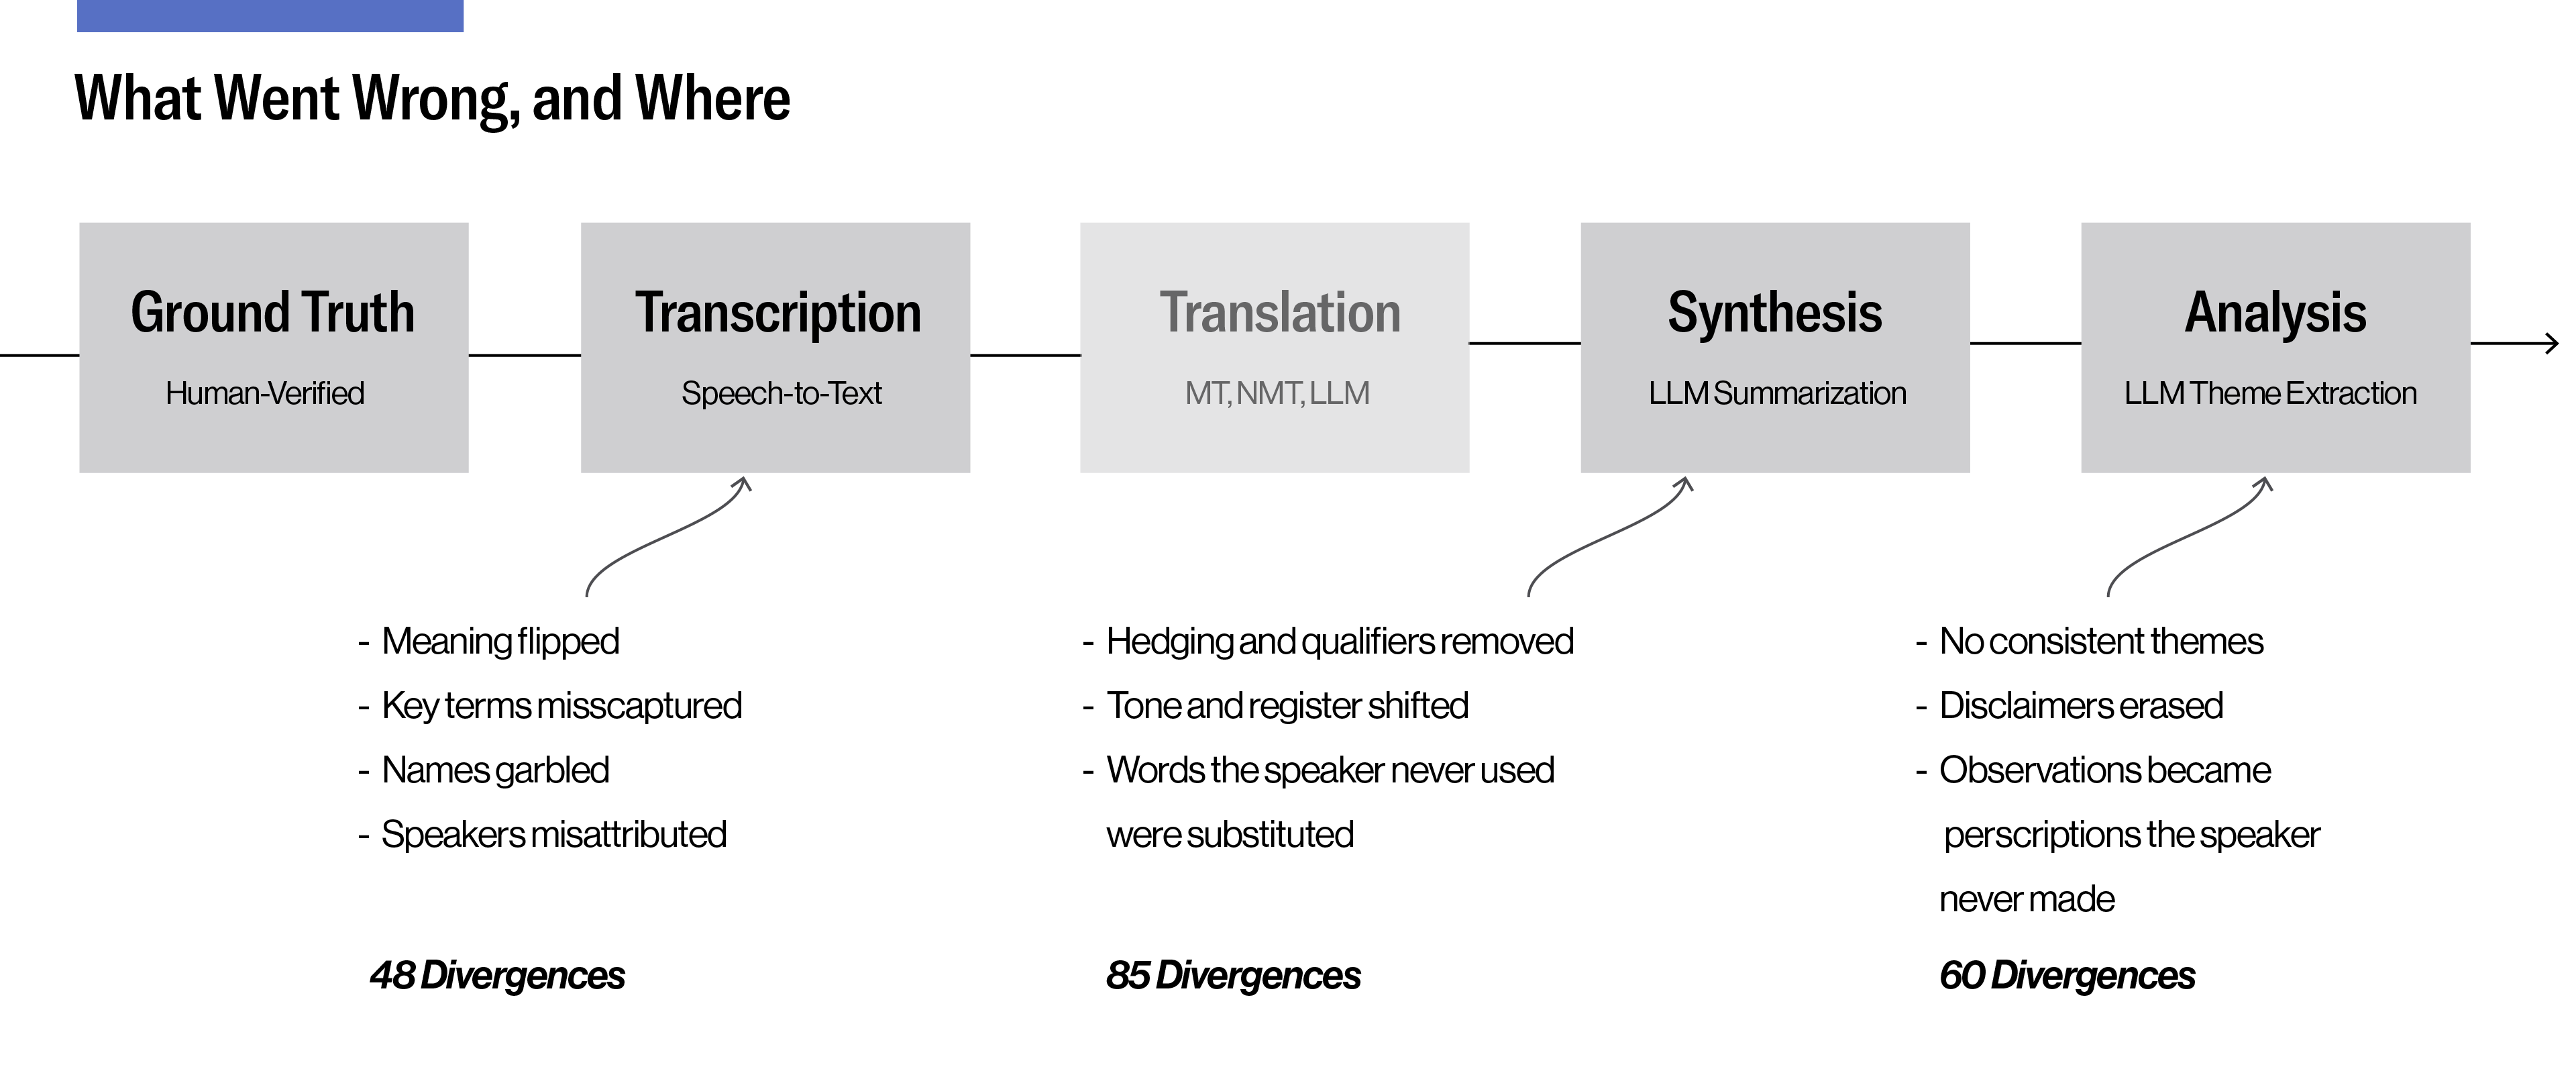
Across all three clips, every tool introduced errors at some stage of the pipeline (see Figure 3); none matched the ground truth I produced manually, including the human transcriber. The following is an example of where the compounding showed clearly.
In one five-minute snippet of “AI Engineering 101 with Chip Huyen (Nvidia, Stanford, Netflix),” I logged forty-eight divergences at transcription, eighty-five more at synthesis, and sixty at analysis. In total that’s 193 divergences from just five minutes of clear accented English audio. Here’s how they unfold across the pipeline:
At transcription. When Lenny asks Chip whether she’s bearish on data labeling companies (specialized service providers that prepare, clean, and tag raw data), she thinks out loud: “I’m not sure if I’m bearish.” Gemini captured “I’m much less bearish;” Reduct returned “I’m actually a bit bearish;” and Rev’s human transcription preserved Chip’s hedge. A second moment showed a different failure mode. When Chip explains what makes evaluation design interesting, she says you need someone who understands “creative writing.” Gemini transcribed “creative writing,” correctly. Reduct returned “curve writing,” a term that doesn’t exist. Rev’s human transcript rendered it “code writing,” a real term from a different domain. Each transcript reads fine on its own; the divergence only shows up when you compare across transcripts and against the source.
At synthesis. The pattern compounds. Chip’s explicit disclaimer—“this is not the philosophy I follow”—was dropped from eight of twelve AI-generated summaries. By the analysis stage, four of twelve AI-generated analyses reversed her distancing entirely. For example, Claude Opus 4.6’s analyses of multiple transcript paths produced the line, “Chip argues that not every feature needs rigorous evals.” She didn’t argue that at all; she explicitly said it was not her philosophy. The creative-writing example mutated differently. GPT-4o passed “curve writing” through as a legitimate evaluation domain. GPT-5.4 produced “story writing,” an invented fourth term. Gemini, summarizing its own correct transcript, changed “creative writing” to “how well it writes code.” The input was right; the synthesis broke it anyway.
At analysis. By the analysis phase, the creative-writing cascade had split into two research directions. The path that preserved “creative writing” recommended investing in people who deeply understand the domain. The path that inherited “code writing” recommended embedding evaluation checkpoints into the feature release cycle. One says hire for taste; the other says build for process.
Divergences Are Decision Points
Chip’s clip is just one example of the error cascades you can expose when you leverage close (human) attention and pull a pipeline apart stage by stage. If you were to run the same exercise on any real source, whether a recorded interview, a focus group, or a podcast clip, you’ll find similar divergences of your own. These divergences matter because each one marks a decision point—translational, interpretive, and often both—where one reading of reality was selected on your behalf, whether by a machine or a fellow human. Errors at these points are inevitable, but they shouldn’t go unlogged. Catching them requires two things:
Transparency into the pipeline;
The ability to stay close to the source.
The potential impact of an error cascade widens, too, with the complexity and stakes of the work: a usability test on button placement can absorb slippage that would wreck a cross-cultural diary study or a dyadic interview. The good news is that most cascades can be prevented, and, using the following blueprint, you can start mitigating them right now.
A Five-Step Blueprint for AI Evals
The following blueprint draws from evaluation work across product disciplines, including from some of the speakers whose podcasts I used in the “evals²” experiment. There are five key steps in the blueprint: define, check, compare, maintain, and ask.
1. Define What Accuracy Means in Your Context
First, you and the researchers using the pipeline must define what it needs to preserve, whether for a single study or for a system that will run many studies through the same steps. The pipeline can hold the criteria but it cannot generate them. It’s likely that your screeners, discussion guides, and research questions already outline what matters, so make sure to review them, especially if they’ve been generated by AI. This so-called “grunt work,” which AI tools promise to spirit away, is nonnegotiable. So, instead of just hopping on the next fastest AI or “train” that comes by, study the maps and the “train schedule” of your research system.
Also, be wary of borrowed metrics. Andrew Bean and colleagues reviewed 445 benchmarks for evaluating language models and found that most lack basic construct validity, meaning they don’t reliably measure what they claim to measure. So when a vendor says that their platform is “88 percent accurate,” that number is only as meaningful as the construct behind it, and may not correspond to anything your research needs to preserve. In short, your own definitions matter.
Hamel Husain and Shreya Shankar, whose work on LLM evals has trained thousands of engineers, warn against “vibes-based” assessment and generic metrics like “helpfulness” that obscure specific failure modes. Follow their lead and examine the step-by-step record of what a model actually did, or its “traces,” to catch where the accuracy of outputs drifts. Start with open coding of real outputs, identify failure patterns inductively, and continue until new examples stop producing new error types. Researchers will recognize this as theoretical saturation applied to AI evaluation. Husain and Shankar recommend spending 60 to 80 percent of development time on this definitional work, and they’re clear about why: “error analysis is the most important activity in evals.” Quality definitions drift just like codebooks, which means the work of defining is an ongoing interpretive practice rather than a one-time setup. Whoever owns the system, whether the researcher or the operations lead building it, has to stay close to the definitions and the judgment behind them.
2. Check Outputs Against the Definition
Next, take a sampling of outputs from your pipeline (ideally spanning multiple phases like transcription, synthesis, and analysis) and compare it against the definitions you’re working with. Did the transcript preserve hedging? Did synthesis surface contradictory perspectives? When you do this, use binary pass/fail, not scales, to indicate success; binary forces clearer thinking and eliminates the ambiguity of middle-ground ratings.
Most of the practical discourse around AI evals is being developed in relatively simple contexts like customer support tickets and code review. Those examples are valuable, but qualitative research happens across an enormous range of interpretive complexity and consequential stakes, and you cannot port a validation framework from one context to the other and expect it to catch what matters. And that is why minimum viable rigor has a twin I call “minimum viable context,” which is about how much the system needs to know about your research for any amount of evaluation to be meaningful. A pipeline with context (i.e., what “good” looks like in the study, who the participants are, and what’s at stake) can do more with less checking. A pipeline without that context cannot be rescued by more checking, because the checks have nothing to measure against.
3. Compare Tools to Surface Divergences
The Chip Huyen experiment is an example of this step. I did it manually, but the principle is scalable. Open-source tools like Promptfoo, which was recently acquired by OpenAI, let you define source texts as test cases, specify multiple models to evaluate, set custom evaluation criteria, and run batch comparisons across all of them. Another set of tools, Monica.im and Poe, will allow you to compare LLM outputs. What doesn’t exist yet, as far as I know, is a tool that’s purpose-built for researchers to prevent error cascades. Imagine if you could run the same source material through multiple AI systems, systematically log where outputs diverge, and track how those divergences compound across pipeline stages. Until that tool exists, the workaround is the method: run at least one source from your actual research through your pipeline, at least once, and the shape of your cascade will come into view. Where tools agree, your confidence is well placed. Where tools disagree, you’ve found the place where human judgment is needed to maintain accuracy.
4. Maintain the Evals Infrastructure
This is easy to say, and harder to do in practice because tools update, models change, and the benchmarks vendors use to make accuracy claims often go stale. Deborah Raji and colleagues showed in 2021 that common evaluation benchmarks get treated as general measures of capability they were never designed to capture. And the EvalEval Coalition, hosted by Hugging Face, the University of Edinburgh, and EleutherAI, exists now because AI evaluation as a whole is unstable and needs ongoing scrutiny. If major published benchmarks aren’t stable, your own evals probably aren’t either. Each project you or a researcher runs using your systems teaches you something about your pipeline, what held up, what broke, and what you missed, learnings that should inform your next round of definitions and checks.
5. Ask Questions That Reveal Hidden Risks
If your technical stack is employer-imposed, or you’re working with a bundled platform rather than individual tools, you may not be able to run comparisons across alternatives. But you can still ask questions that close the gap. For instance:
What’s the model mix: how many and which models are chained, and what does each one do?
Can you check intermediate outputs, or only the final result?
Can you export at each stage?
What benchmarks are the accuracy claims based on, and on what kind of data were they validated?
Can you trial the tool on your own data before committing?
These are information-gathering questions, not “gotcha” traps. If you’re working with a vendor, you need them to understand where your signal might be degrading in the pipeline. If a vendor can’t or won’t answer these questions, that tells you something about both the vendor and the weaknesses you stand to inherit from them.
Evaluation Is a Process, Not a Destination
The promise of AI tools, again, was that the grunt work of doing research would disappear. The reality is that grunt work doesn’t ever really disappear so much as it shapeshifts. Instead of doing transcription and synthesis manually, or managing the people or systems who did it, you must now do the harder and less visible work of defining quality in your context, building that into your configurations (and operations), checking whether outputs preserve what matters, and updating your criteria as you learn. That’s more skilled labor, not less, and it’s labor that doesn’t register as traditional “research,” whether you’re the researcher doing a single study or the operations lead protecting the work of fifty or 500 researchers.
Remember what Chip Huyen was actually talking about in the experiment around “creative writing.” Evaluation design requires someone who deeply understands the domain and can think about what makes something good in that specific context. That exercise of understanding is also where craft lives, whether in a researcher’s interpretive judgment and proximity to participants or in a ResearchOps professional’s grasp of how a pipeline behaves across many studies. And it’s a key source of competitive differentiation, because no one else has exactly that combination. The job of anyone building a research system around craft is to make sure the key ingredients of judgment and understanding show up reliably even when they aren’t the one doing the work.
I remember the exact backstreet I was on in 2008—a tiny, dead-end lane in the heart of Tokyo, and a prime place for getting lost. A friend who was an early adopter of tech pulled out his iPhone and showed me Google Maps’ blue dot for the first time. It conveyed “you’re somewhere in this area” rather than “you’re exactly here.” Over time, the blue dot improved, becoming more precise, more responsive, and more directional. Someone had to iteratively create the dot: first, it was a rough circle; then a directional arrow; then it offered turn-by-turn guidance that could reroute if you missed your stop. Each version built on the last, and none of them had to be perfect to be useful.
The AI evaluation blueprint works the same way: your first set of definitions will be incomplete; your first checks will miss things; your first comparison will raise more questions than it answers. But see that as the process working, not failing. Understanding your research pipeline, your definition of good enough, and which tools and models can help you get there is not something you can solve all at once. Instead, you must compare, learn, and iterate, so that the next time you know more.

The ResearchOps Review is made possible by User Interviews, now part of UserTesting. With a vast participant network, precise matching, and fraud prevention, User Interviews can reliably fill any research study. Source, screen, track and pay participants, then move seamlessly from data collection to deep analysis, all in one place. → Learn more about User Interviews for ResearchOps.
Today, Tokyo has thirteen subway lines (the Fukutoshin Line opened in 2008). Adding to the complexity, in the mid-2000s, getting across the sprawling city could require three separate paper tickets.
Towsey, Kate. 2025. Research That Scales: The Research Operations Handbook. Rosenfeld. https://rosenfeldmedia.com/books/research-that-scales/, Chapter 4 “Planning Realistic ResearchOps,” 71–75.
“AI Research Companions” is User Interviews’ term for AI tools spanning the research pipeline, from general-purpose chatbots like ChatGPT and Claude to platforms that moderate interviews and produce insights end-to-end.
Shaw, Steven D., and Gideon Nave. “Thinking—Fast, Slow, and Artificial: How AI Is Reshaping Human Reasoning and the Rise of Cognitive Surrender.” The Wharton School Research Paper, (2026). Accessed April 21, 2026. https://doi.org/10.31234/osf.io/yk25n_v1.
I drew on the public benchmarks the field uses at each stage: WER for transcription, BLEU/chrF/METEOR for translation, and MMLU-Pro for reasoning. Full details on evaluation techniques and the math are available to read in this essay.
The three clips came from Lenny’s Podcast episodes on AI evals, featuring Hamel Husain and Shreya Shankar (Standard American English), Chip Huyen (Vietnamese-accented English), and Aishwarya Reganti and Kiriti Badam (Indian-accented English). The transcription tools were Gemini, Reduct, and Rev’s human transcription (the service Lenny uses for the show’s published transcripts). I also produced a ground-truth human transcript using Reduct’s video-alongside-text feature. The summarization models were Claude Opus 4.6, Gemini 3.1 Pro, GPT-5.4, and GPT-4o, each given the same simple prompt. The analysis tool was Claude Opus 4.6, which extracted themes from all twelve summaries, with always-fresh calls and no memory between runs. Three transcripts branched into twelve summaries, which branched into twelve analyses. View the full methodology, prompts, and CSV error logs in my “evals-squared-experiment” GitHub.
 | A guest post by
|